The following information is provided to help with basic troubleshooting steps for the ComXchange PBX. There are tools in the ComXchange Web Gui, Command line tools, as well as other software that will be helpful in diagnosing configuration and other issues.
Web Gui Modules and Reports
ComXchange Reports
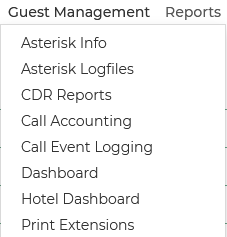
The ComXchange Reports Tab on the Navigation Menu provides links to modules that can provide helpful information from the Asterisk server.
Asterisk Info
Provides reports on:
Registries – Status of Trunk Registrations
Channels - Active Calls
Peers – Extension registration status and IP information
Conferences – Active Conference Bridge Information
Subscriptions – Registered Asterisk Dialplan Hints (Park, BLF,Queues, etc)
Queues – Information on Queues and Agent Status
Asterisk Log Files
Provides access to various system log files including the asterisk “Full”log file that will provide asterisk call detail events, pms log, license log, fail2ban logs, etc
Call Event Logging
Logs of system calls with links to a web table of the asterisk logs for the call
CDR Reports
A reports listing Call Detail Records which has a summary of call information as well as a link in the systems column to the call form with call data from top to bottom
Call Event Logging
A simpler view of call information on the server with a link that provides more detailed, step-by-step records of events within a call's lifetime
Print Extensions
The Print Extensions report can be used to easily verify staff and guest extensions, feature codes, Inbound routes, and other call destinations.
Troubleshooting with Other Web GUI Modules
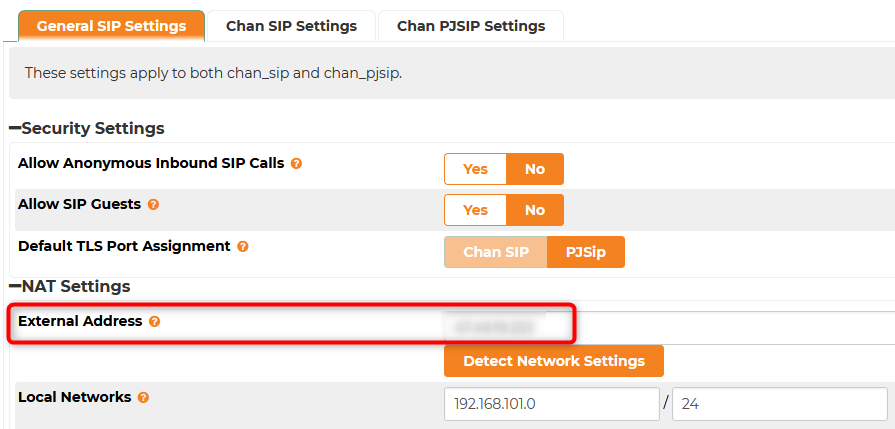
Sip Settings
The wrong External IP address in the General Settings tab - Nat Settings can cause issues with one way audio or failed outbound calls over a trunk. The IP address entered in this field in most cases should match the WAN IP address of the ComXchange Server. The SIP Local Networks, found in "Asterisk SIP Settings," define the internal IP ranges where local phones and devices reside, allowing the PBX to correctly handle NAT.
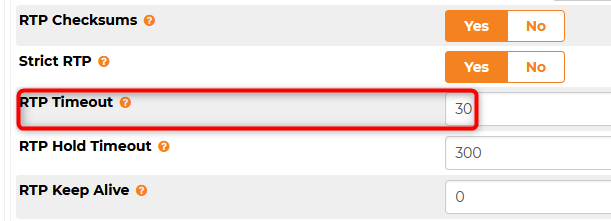
You may come across devices that are not sending nat such as some paging devices where calls prematurely hang up you can set the rtp timeout from the default 30 seconds to something like 5 minutes to alleviate the issue
License
In the License Module you can verify that the License application is running and the license is Active as well as the station count is within the limit of the license. Issues with Guest Features such as PMS, Call Accounting, Wakeup calls, or the inability to apply configuration changes (getting a reload error) could be attributed to an inactive license. You can verify the license is active in the Admin > License module
System Settings > DHCP -Leases
The DHCP leases tab will provide the ip address associated with a devices mac address. This can be helpful when trying to add a phone or gateway to verify they are on the network and can communicate with the ComXchange Server
System Settings > Intrusion Detection
Devices that try to register to the ComXchange server with bad credentials will be banned from trying to register again for a time specified in the Intrusion detection settings. If you are having registration issues you can check this module to see if the device has been banned.
System Setting > NTP
If your devices are not getting the correct time you verfy the server time and allowed client networks in the NTP Module. Other causes for the wrong time on devices could be the NTP settings in the device configuration as well.
System Settings > Services
You can verify that system services are running and restart them in the Service Module
Hotel Dashboard
The hotel dashboard at 192.168.101.2:8080 (be default) is useful to verify the room status, names, and restrictions of guest phones. It is also helps verify the PMS connection is functioning and populating information automatically
Interface Testing
There are a few tools that can be used to help in testing the PMS interface and the Call Accounting Server interface that connect to the PMS from the ComXchange Server. You can see interface date the interface logs and data monitor for Call Accounting, run a room status from the PMS interface web gui or run a test from the Call Accounting web gui, and perform a loopback test. For more detailed information see this article https://kb.clearlyip.com/comxchange/Interface-Testing.html
Terminal Emulator and CLI Commands
There are many terminal programs available to remote into servers and devices. Putty is a very popular program that is free to use. With a terminal emulator you can use SSH to console into the ComXchange server. This can be useful to see data in the Asterisk server, restarting services, viewing log files and monitoring log files and monitoring call events in realtime.
Connect to the ComXchange over VPN or the local network then use SSH to log into the ComXchange Server. You can use Linux commands or you can enter the Asterisk CLI to monitor and interact with the asterisk server.
Common Commands for linux:
Below are some common commands that you may use in the linux command line as well as some of the log files that you may want to monitor.
- ifconfig - shows status of your Ethernet interfaces (including assigned IP address and MAC address).
- ip addr (display IP information for all devices)
- ping - always useful for checking network connectivity and/or connectivity to specific remote hosts and networks.
- dig / nslookup - useful for troubleshooting DNS errors. Ie. dig www.google.com or nslookup www.google.com.
- df -h - check free disk space
- top / htop - live system resource utilization
- ps aux - show all running processes
- grep - extract specific information from a command. Ie. ps aux | grep
- pwd - ‘print working directory’ will print the path to your current directory.
- ls - gives you a list of names of files and directories. Can vary the output with flags such as ‘ls -la’ which shows all files and directories (even hidden ones) in ‘long listing’ format.
- man - stands for ‘manual’ - shows usage instructions for any command. Try ‘man ls’ and see what the various flags are.
- cd <name of directory> - change to a different directory. You can use ‘cd ..’ to go back (or ‘up’) a directory.
- cat <filename> - prints the contents of a file - you can go page by page by using ‘cat <filename> | more’ or you can simply do ‘more <filename>’
- tail <filename> - shows the last 10 lines of a file (such as a log file). To show a custom number of lines do ‘tail -50 <filename>’ where -50 is the number of lines you want to see. You can also do ‘tail -f <filename>’ to show the last 10 lines of a file, and continuously display new lines of the file as they are written - very handy for troubleshooting
Systemctl and Journalctl and common services
- systemctl - the primary command-line utility used to manage and inspect the systemd system and service manager
- systemctl enable|disable|restart|status|stop <service_name>
- Example
- journalctl - Linux utility used to view, query, and manage logs collected by the systemd-journald service used to to view logs for a specific service (e.g., isc-dhcp-server):
- journalctl -u <service> -f
- The -f option follows the log messages live as they are written
- journalctl -u isc-dhcp-server -f
- journalctl -u escdr.svc -f
- The -f option follows the log messages live as they are written
Apache Web Server
- ComXchange 14 - httpd
- ComXchange 17 - apache2
Call Accounting
- systemctl status escdrsvc.service
- journalctl -u escdr.svc -f
Chrony (NTP)
- ComXchange 14 - chronyd
- ComXchange 17 - chrony
- Trouble shooting Chrony (NTP) issues
- timedatect - Used to get the current system time
- systemctl status chrony - Check Status: Confirm the daemon is active
- chronyc sources -v - Check Sources: Run to see if sources are reachable.
- ? in the first column indicates no connectivity or unreachable server
- * means it is currently synchronized.
- chronyc sourcestats - Check Drift: Use to see if the server is estimating drift/offset.
- chronyc tracking - Check Tracking: to verify the local system is tracking a reference clock.
DHCP
- ComXchange 14 - dhcpd
- systemctl status dhcpd
- tail -f /var/log/messages
- ComXchange 17 - isc-dhcp-server.service
- systemctl status isc-dhcp-server.service
- journalctl -u isc-dhcp-server -f
- To follow all DHCP-related journal entries in real-time:
- journalctl -f | grep -Ei 'dhcp|dhcpd|dhclient'
Fail2ban
systemctl status fail2ban
- fail2ban-client banned <Press Enter to get jailed IP's>
- fail2ban-client status <Press Enter to get jail list>
- fail2ban-client status <jail-name>
- fail2ban-client status sshd
- fail2ban-client set <jail-name> unbanip <ip-address>
- fail2ban-client set sshd unbanip 192.168.101.21
Iptables / netfilter-persistent
- ComXchange 14 - iptables
- systemctl status iptables
- ComXchange 17 - netfilter-persistent
- systemctl status netfilter-persistent
In ComXchange 17 iptables-persistent is a plugin and boot-time loader for netfilter (the kernel module behind iptables) on Debian/Ubuntu systems. Iptables-persistent uses netfilter-persistent to save and load iptables rules from /etc/iptables/rules.v4 and /etc/iptables/rules.v6.
Networking
- ComXchange 14 - network
- systemctl status network.service
- ComXchange 17 - systemd-networkd.service
- systemctl status systemd-networkd.service
- Netplan apply - netplan apply is the recommended way to apply network configuration changes as it reads /etc/netplan/*.yaml files and generates the necessary backend configuration for systemd-networkd.
- systemctl restart systemd-networkd.service only restarts the service without generating new configuration from Netplan.
- You can see and edit the 50-cloud-init.yaml configuration file for ComXchange 17
- vim /etc/netplan/50-cloud-init.yaml
- netplan --debug generate
- is used to dry-run the generation of backend configuration files from your Netplan YAML files while providing detailed logs of the process
- netplan apply
- The warning "Cannot call Open vSwitch: ovsdb-server.service is not running" is a non critical warning as this is not used and can be ignored
Note: the file /etc/cloud/cloud.cfg.d/99-disable-network-config.cfg needs to exist with the line "network: {config: disabled}"for networking configuration to persist throug a reboot
OpenVPN
- ComXchange 14 - openvpn@server.service
- systemctl status openvpn@server.service
- ComXchange 17 - openvpn-server@server.service
- systemctl status openvpn-server@server.service
- Troubleshoot OpenVPN ComXchange 17
- journalctl -u openvpn-server@server.service -f
- tail -f /var/log/openvpn/openvpn.log
TFTP
- ComXchange 14 - xinetd
- Troubleshooting TFTP ComXchange 14
- tail -f /var/log/messages
- tail /var/log/messages | grep tftp
- ComXchange 17 - tftpd-hpa
- systemctl status tftpd-hpa
- Troubleshooting TFTP ComXchange 17
- cat /var/log/syslog | grep 'tftpd'
- tail -f /var/log/syslog | grep 'tftpd'
- If you cannot see any TFTP related messages you may need to set monitoring up or increase the verbosity in the /etc/default/tftpd-hpa file. Add or modify the OPTIONS line to include -v or -vv (for higher verbosity).
- vim /etc/default/tftpd-hpa
- add or modify the line
- TFTP_OPTIONS="--secure -v"
- Save the file
- restart the tftpd service
- systemctl restart tftpd-hpa
Navigating log files
tail - tail is very useful for viewing log files. tail -X [/path/to/logfile] will display the last X number of lines of that logfile. tail -f [/path/to/logfile] will continuously display the logfile as entries are written.
Common log files for troubleshooting:
/var/log/messages - the main Linux logfile.
/var/log/maillog - SMTP log
/var/log/asterisk/full - the main Asterisk logfile
Useful Fwconsole/Asterisk commands:
Fwconsole Commands
- fwconsole restart - restart FreePBX and all related services
- fwconsole reload - reload FreePBX configuration (same as pressing ‘Apply Config’)
- fwconsole chown - set ownership of all FreePBX files
- fwconsole pm2 --list - See a list of pm2 services running
- fwconsole pm2 --log <service name> - see a running log of the pm2 service
Asterisk Commands
Asterisk - the Asterisk CLI is incredibly useful for watching PBX activity and running commands in Asterisk that can show you phone/trunk status, set debugging levels, and enabling/disabling services.
- asterisk -rvvv - enter the Asterisk command line. You can add more ‘v’s’ for additional verbosity.
- sip show peers (display SIP peers and IP)
- sip show peer <extension> (display information for a specific extension)
- sip show registry (display SIP registries)
- sip set debug on/off (turn sip debug on and off) note: remember to shut off
- Sip set debug peer 7001 (debug a specific peer)
- Sip set debug ip <IP Address> (debug a specific ip address)
- core/pjsip set debug on/off - turn debugging on/off
- pjsip show registrations - show pjsip registrations (pjsip SIP trunking status)
- pjsip show endpoints - summary of pjsip endpoints (pjsip extension information)
- pjsip show endpoint <extension number> - detail of a single pjsip endpoint
- ari set debug on/off - see information on ARI applications
Tcpdump
Tcpdump is a powerful tool for analyzing network traffic going to and from your server. With the proper filter settings it is possible to isolate SIP and RTP packets.
Here are some practical examples of commands we use. tcpdump has some parameters that can be used if desired which can be found in the tcpdump man page. Examples
- -i: Interface name or use any for all interfaces
- -n[nn]: Disables DNS/service name resolution. -nn also disables port name resolution (recommended for speed).
- -q: Quick output. Print less protocol information so output lines are shorter.
- -t: Don't print a timestamp on each dump line
- -A: Prints Packets in ASCII which can be helpful in reading SIP headers
- -s 0: Captures the full packet not just the headers
- -vvvv: highly verbose output
Tcpdump Command examples
- View all SIP traffic in realtime
- tcpdump -nqt -s 0 port 5060
- View verbose full SIP packets in ASCII format
-
tcpdump -i any -A -s 0 -vvv port 5060
- View SIP traffic by IP And port
- tcpdump -nqt -s 0 -A host xx.xx.xx.xx and port 5060
- View SIP activity from a source IP and a destination port
- tcpdump -nqt -s 0 -A "src host xx.xx.xx.xx and dst port 5060"
- View SIP traffic packet headers on interface enp4S0
- tcpdump -i enp4s0 -nqt port 5060
- View asterisk RTP Traffic (VOICE)
- tcpdump -nqt portrange 10000-20000
Writing to a file with TCPdump
Note: these can take up alot of space so be aware of disk space and remove. The captures when done and can be downloaded from the server to a PC with an application like WinSCP
- To Save SIP activity to a file
- tcpdump -n -s 0 port 5060 -vvv -w /tmp/capture_file_name
- To Save SIP AND RTP activity to a file
- tcpdump -n -s 0 port 5060 or udp portrange 10000-20000 -vvv -w /tmp/capture_file_name
- To save all network activity from a specific port such as eth0
- tcpdump -i eth0 -w /tmp/capture.pcap
- To save traffic from any interface
- tcpdump -i any -w /tmp/capture.pcap
Diagnosing SIP issues with Wireshark and Tcpdump Captures
Diagnosing with WireShark involves capturing packet traffic on the network interface to a file and using that file for filtering for sip, and using Telephony > VoIP Calls to analyze call flows and identify failed messages (e.g., \(4xx-6xx\) errors). Key techniques include filtering by Call-ID, checking SDP for media negotiation, and analyzing RTP streams for voice quality issues like jitter or packet loss.
Key Steps for SIP Troubleshooting Capture Traffic
- Use Wireshark to open a packet capture that was done to reproduce the call issue (dropped, one-way, no audio).
- Locate traffic from a server or an endpoint by IP
- Enter ip.addr == x.x.x.x in the filter where x.x.x.x is the IP address of the device
- Locate SIP Traffic: Use the display filter sip to isolate signaling.
- Analyze Call Flow: Navigate to Telephony > VoIP Calls, select the target call, and click Flow Sequence to visualize the exchange between the User Agent Client (UAC) and User Agent Server (UAS).
- Identify Errors: Look for SIP response codes \(\ge 400\). Common errors include:401/407 Unauthorized: Authentication issues.
- 404 Not Found: Incorrect routing or dial plan.
- 486 Busy Here: Destination is busy.
- 487 Request Terminated:
- Call was cancelled (often by a 200 OK after a CANCEL).
- Inspect SIP Headers/SDP: Examine the INVITE request for correct From, To, Contact, and Content-Type: application/sdp to ensure proper media negotiation (codecs, IP addresses).
- Analyzing Audio (RTP) Issues If signaling is successful but audio fails:
- Filter for RTP Traffic:
- RTP Stream Analysis: Go to Telephony > RTP > RTP Streams to check for high jitter, excessive packet loss, or incorrect IP addresses.
- Hear the Audio: Use Telephony > RTP > RTP Streams, select the stream, and click Analyze > Play Streams to hear the audio, confirming one-way or no-audio issues.
Diagnosing live call traffic at the ComXchange with SNGREP
Sngrep is an utility that provides a visual representation of SIP traffic directly from an established SSH session, without downloading anything outside the ComXchange system.
It may be possible this package needs to be installed, for ComXchange systems 14 this can be done with the following command (via SSH)
yum localinstall -y http://packages.irontec.com/centos/7/x86_64/sngrep-1.4.9-0.el7.x86_64.rpm
Once installed, run it with the command sngrep -r
The -r flag allows you to capture the RTP traffic, in case you need to confirm issues with audio this is an useful flag to not discard the RTP when live capturing.
Check additional usage tips and options on this link: https://clearlyip.com/2022/01/25/live-debugging-with-sngrep/
 Uploading ....